· 7 min read
How to interpret shaft orbits in turbomachinery
What a shaft orbit is, how X/Y probes and the Keyphasor build it, and what typical shapes reveal about unbalance, preloads, rubs and instability.
Andrés González
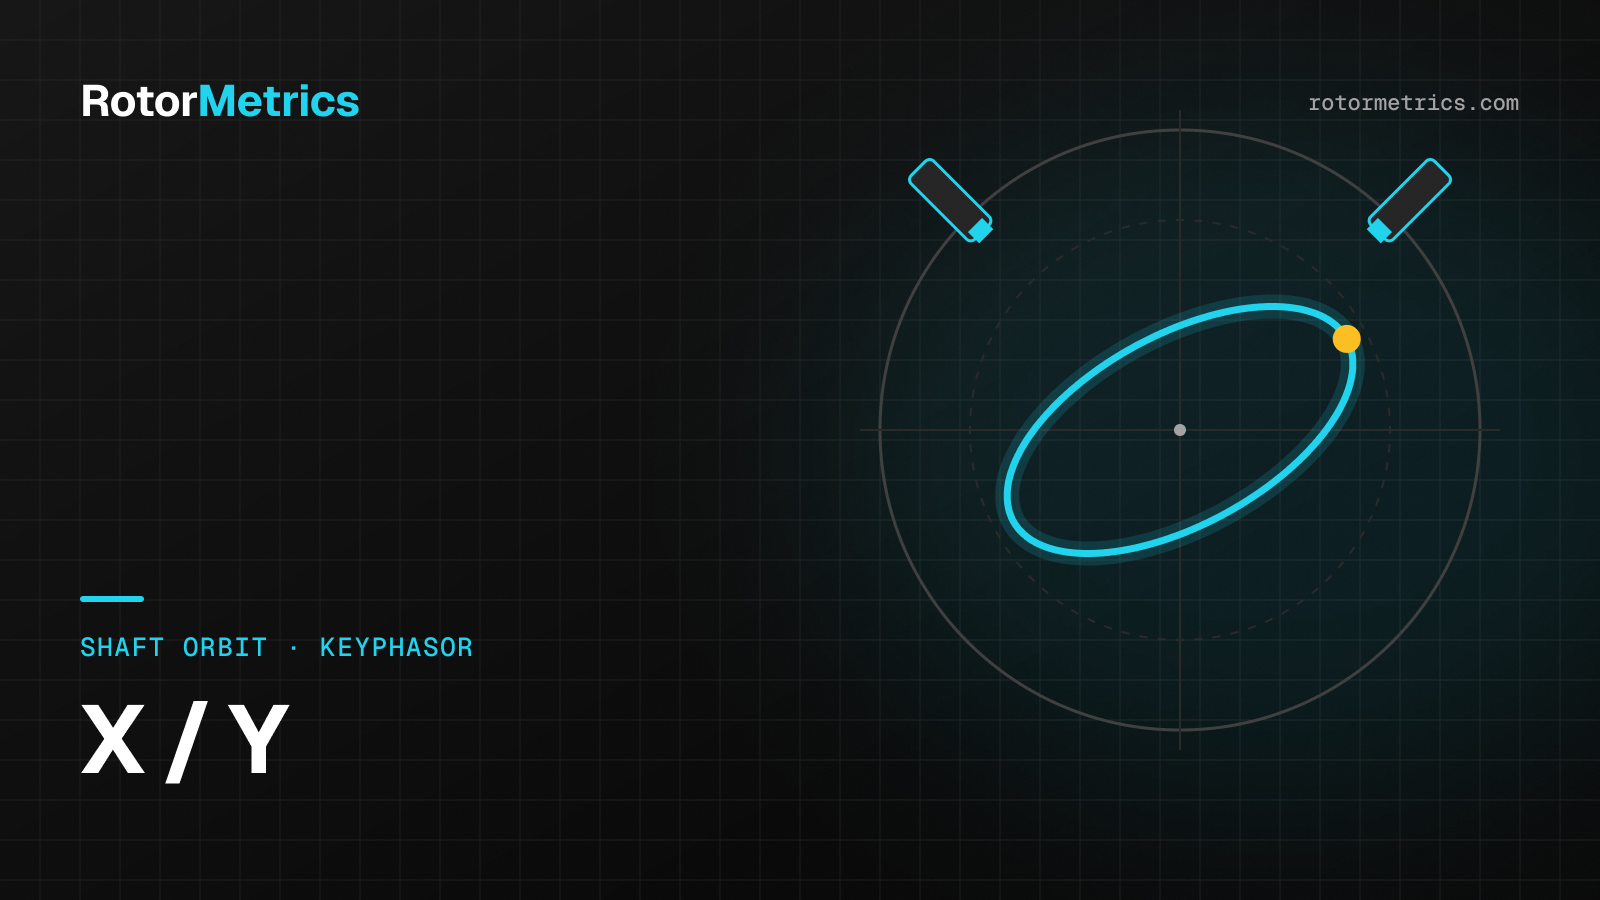
A spectrum tells you at what frequency a shaft is vibrating. An orbit tells you how it is moving. On turbomachinery with fluid-film bearings, a single orbit plot shows the shape of the motion, its direction, and its phase relative to a mark on the shaft, along with strong clues about unbalance, preloads, rubs, or instability.
It is also one of the easiest plots to misread. A probe configured with the wrong orientation or uncompensated runout can completely change what seems to be going on. This article walks through how an orbit is built, how to read it step by step, and which mistakes to avoid.
From two probes to one orbit
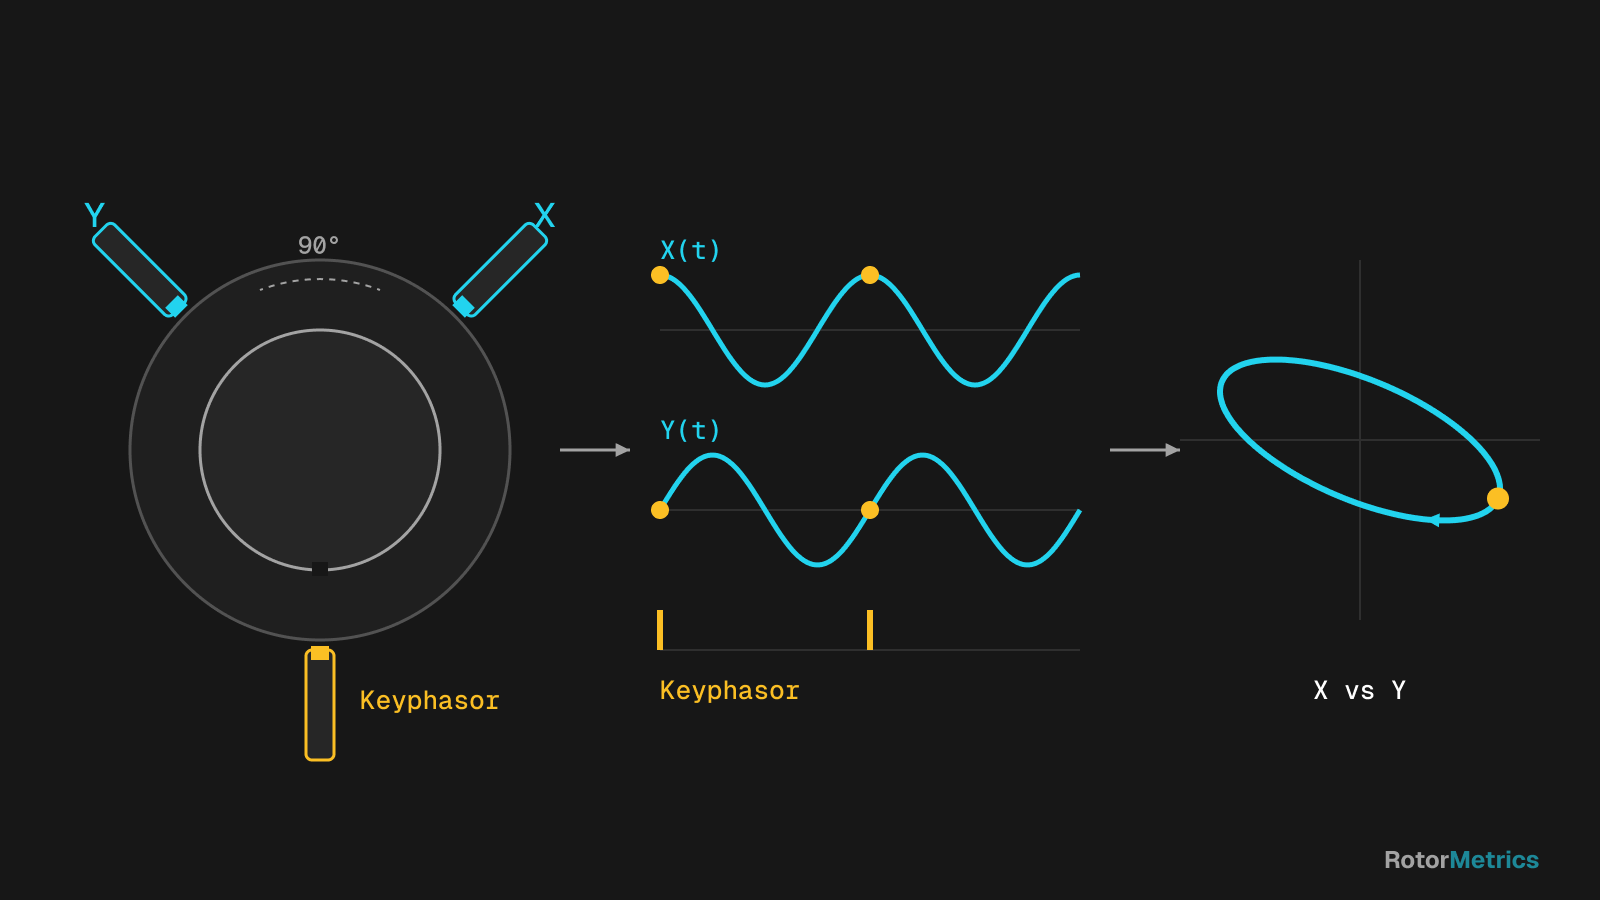
An orbit is the path the shaft centerline traces inside the bearing. To draw one you need:
- Two proximity probes in the same plane, 90° apart, labeled X and Y. The most common installation places them 45° on either side of vertical, viewed from the driver end. Each probe measures the gap to the shaft, so its signal has a DC part (the average position, or gap voltage) and a dynamic part (the vibration).
- A once-per-turn phase reference (Keyphasor): a notch or keyway on the shaft and a probe that produces one pulse per revolution.
- Simultaneously sampled waveforms from X and Y, not just overall values.
The orbit is simply the Y signal plotted against the X signal, point by point, on the same scale. Two sine waves of equal amplitude, 90° apart, produce a circle. Change the amplitudes or the phase difference and you get an ellipse. Add more frequencies and the shape becomes more complex.
The Keyphasor dot
Every time the notch passes the Keyphasor probe, the software places a dot on the orbit. That dot marks where the shaft was at that instant and ties the orbit to the 1X phase angle. A few practical rules:
- A 1X filtered orbit shows a single dot, and it stays put as long as the phase is stable.
- If the dominant vibration is near 1/2X, you see two dots, because the pattern repeats every two revolutions.
- If the subsynchronous component is not an exact fraction (for example, the 0.42X–0.48X range typical of oil whirl), the dots drift from one revolution to the next.
Filtered 1X vs. direct (unfiltered) orbits
The same data can be displayed in different ways, and you should always look at more than one:
| Orbit type | What it contains | What it is good for | Limitation |
|---|---|---|---|
| Direct (unfiltered) | Every frequency, including runout and noise | Seeing the real shape: truncation, loops, harmonics | Can look messy with noise or runout |
| 1X filtered | Only the running-speed component | Reading unbalance, 1X phase, 1X precession | Always an ellipse; hides rubs and subsynchronous motion |
| nX filtered (2X, 0.5X…) | One selected component | Isolating a specific mechanism | You need to know what you are looking for |
A 1X filtered orbit is, by definition, an ellipse (or a circle, or a line in the extreme case), so there is no point looking for a banana or loops in it. Comparing it with the direct orbit quickly shows how much of the motion is synchronous.
Precession direction: forward or reverse
Precession is the direction in which the shaft centerline travels around the orbit:
- Forward precession is in the same direction as shaft rotation. It is the normal case under most conditions, including unbalance and fluid-film instability.
- Reverse precession runs opposite to rotation. It is uncommon and deserves a closer look. It is usually associated with severe rubs, with heavy radial preloads that flatten the orbit, or with highly asymmetric support stiffness.
To read precession correctly you need to know the direction of rotation and the actual probe orientation. The dot-blank sequence of the Keyphasor mark shows which way the shaft is moving, as long as the probes are set up correctly in the software. That last condition is exactly where many errors start, as we discuss below.
Typical shapes and what they suggest
No orbit shape is a diagnosis on its own, but some patterns point you in the right direction.
Elliptical
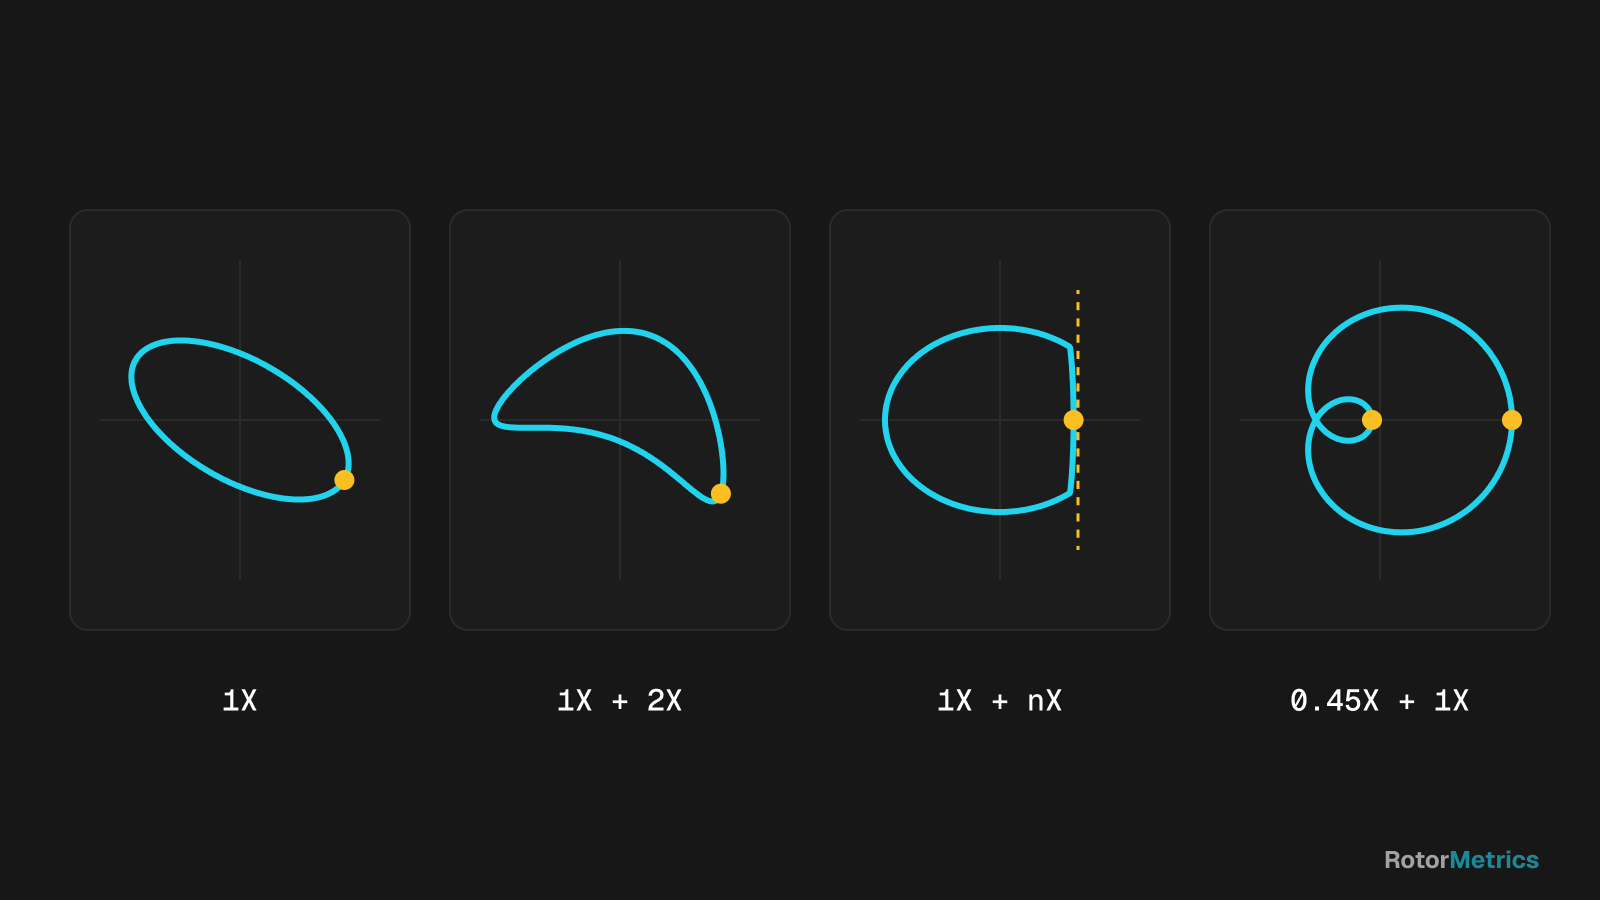
This is the typical orbit of unbalance, dominated by 1X: a stable ellipse, a Keyphasor dot that does not move, and forward precession. An ellipse rather than a circle is not a problem in itself; it usually reflects different bearing or support stiffness in the vertical and horizontal directions.
Flattened, banana, or figure eight
When a radial preload pushes the shaft against one side of the bearing (misalignment, gear loads, process forces), the orbit flattens. If there is also significant 2X, the shape bends into a banana and, in stronger cases, can close into a figure eight with an internal loop. These orbits usually come with a shaft centerline that has shifted away from its normal position.
Try it here and see how misalignment changes the orbit:
Truncated or clipped
A rub limits shaft motion in one direction. The orbit looks flattened against one side, with abrupt changes in its path. The waveform shows clipped peaks, and the spectrum picks up harmonics and sometimes fractional components. If the rub is heavy and runs all the way around the seal or bearing, precession can reverse.
Internal loops
A direct orbit with internal loops and Keyphasor dots that will not stay still points to a subsynchronous component with forward precession. This is the classic signature of fluid-film instability (oil whirl and oil whip), which we cover in depth in our article on oil whirl and oil whip. It is a finding to watch closely, because it can grow quickly with changes in oil temperature, load, or speed.
Orbit and shaft centerline: two sides of the same story
The orbit shows dynamic motion. The shaft centerline plot shows the average position of the shaft inside the bearing, calculated from the probe gap voltages. Reading them together keeps you from jumping to conclusions:
- A flattened orbit with a highly eccentric shaft (pushed against one side of the bearing) points to a strong preload.
- A shaft that sits too close to the bearing center at running speed, with a low eccentricity ratio, is generally more prone to instability.
- A slow drift of the centerline over time can indicate bearing wear, thermal alignment changes, or load changes.
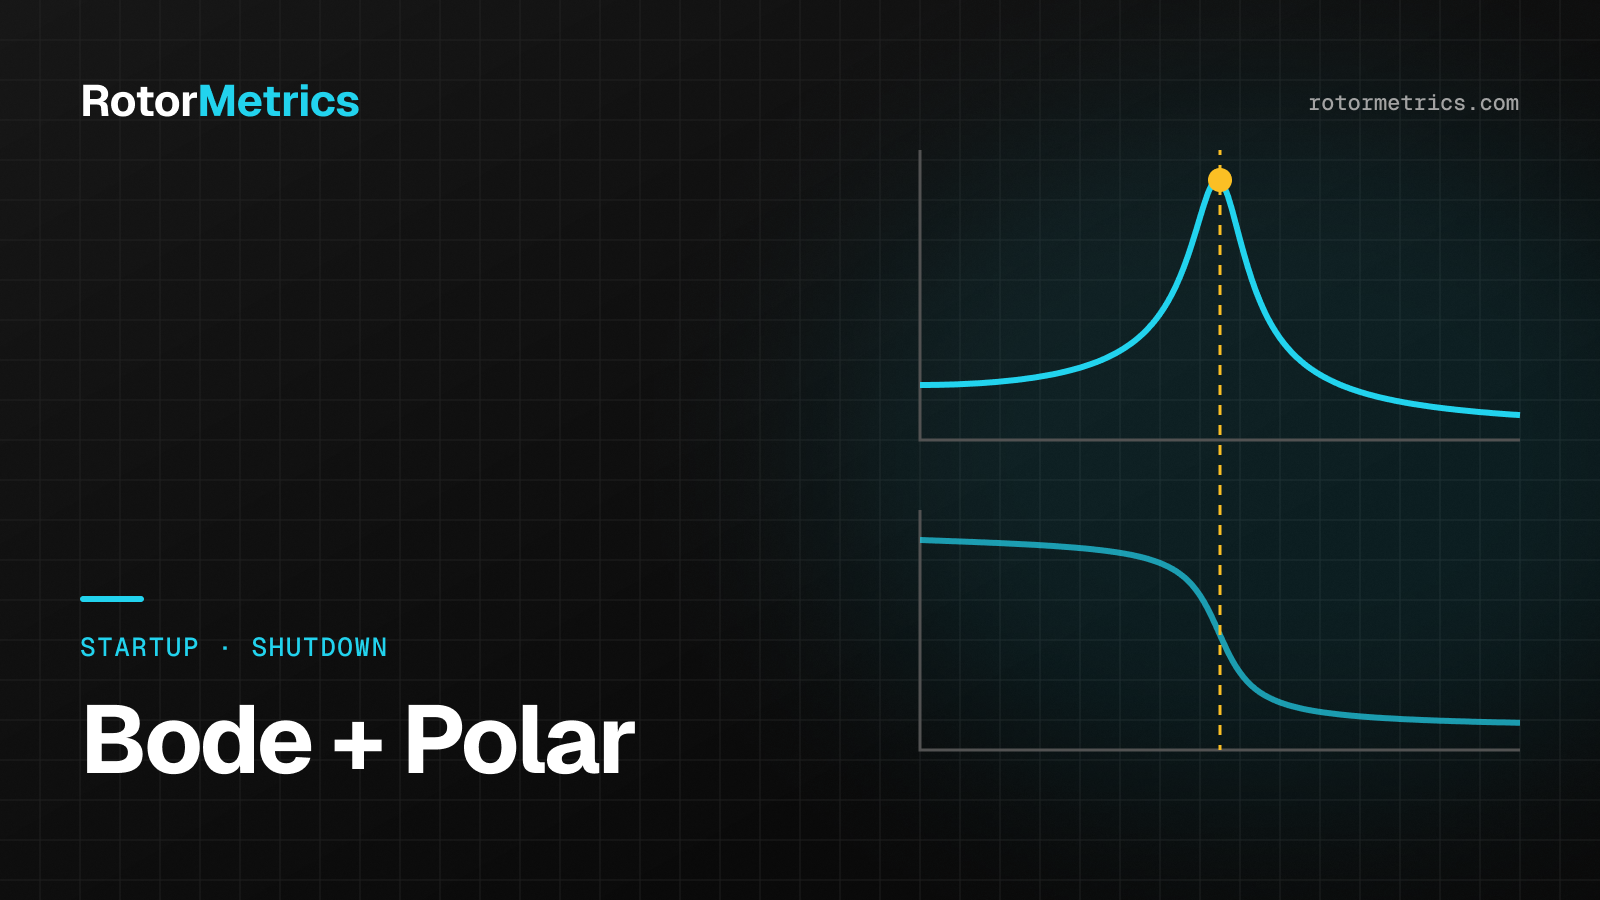
During startups and shutdowns, the centerline and the 1X response are best read alongside Bode and polar plots, which we explain in startup and shutdown analysis.
Common mistakes when reading orbits
Not compensating for runout
Proximity probes see every irregularity on the shaft surface (scratches, material variations, residual magnetism). That "false vibration" is mechanical and electrical runout. It is identified by measuring at slow roll, where there is essentially no dynamic response, and then subtracted as a vector from the readings at operating speed. API equipment standards typically limit combined runout to a fraction of the allowable vibration, but even within that limit it can distort a low-amplitude orbit.
Getting the probe orientation wrong
If X and Y are swapped in the software, or the mounting angles and direction of rotation are entered incorrectly, the orbit comes out rotated or mirrored. The most dangerous consequence is that precession looks reversed when it is actually forward, or the other way around. Check the angle convention (which end of the machine you view it from and which reference the angles are measured from) at every measurement plane.
Different scales on X and Y
An orbit only makes sense if both axes use the same scale, in mils or µm pp. Independent autoscaling on each axis can turn a circle into an apparent ellipse.
Looking at a single orbit
An orbit is a snapshot. What really matters is how it changes: against the healthy-machine baseline, between bearings on the same train, and with speed and load. To see where orbits fit in a complete diagnosis, read how to detect turbocompressor faults.
How RotorMetrics does it
We take the X/Y probe and Keyphasor waveforms from your existing protection system (for example, a Bently Nevada 3500) without modifying it. Our specialists review direct and filtered orbits, shaft centerline, spectra, and trends against each machine's baseline, verify probe configuration and runout, and let you know when something changes, with a specific recommendation for your maintenance team.
Sources
- Bently, D. E., and Hatch, C. T. Fundamentals of Rotating Machinery Diagnostics. Bently Pressurized Bearing Press, 2002.
- Eisenmann, R. C. Sr., and Eisenmann, R. C. Jr. Machinery Malfunction Diagnosis and Correction. Prentice Hall, 1998.
- Muszynska, A. Rotordynamics. CRC Press (Taylor & Francis), 2005.
- American Petroleum Institute. API Standard 670: Machinery Protection Systems, 5th edition, 2014.
- ISO 20816-1:2016. Mechanical vibration — Measurement and evaluation of machine vibration — Part 1: General guidelines.
Want us to watch your machine?
Let's talk about your critical equipment and we'll show you how we'd monitor it.
Book a call