· 7 min read
How to justify online monitoring with the cost of unplanned downtime
A practical method to build the business case for online vibration monitoring from the real cost of an unplanned shutdown and your own failure history.
Andrés González
"What will online monitoring save us?" Management asks it every budget cycle, and it usually gets a weak answer: an ROI percentage lifted from a brochure, or a war story about the last failure. Neither survives a serious finance review.
You can build a defensible answer from data your plant already has. Here is a simple method to estimate what an unplanned shutdown really costs, how much of that cost early warning can avoid, and how to compare it with the cost of the service, without promising results nobody can guarantee.
Step 1: what an unplanned shutdown really costs
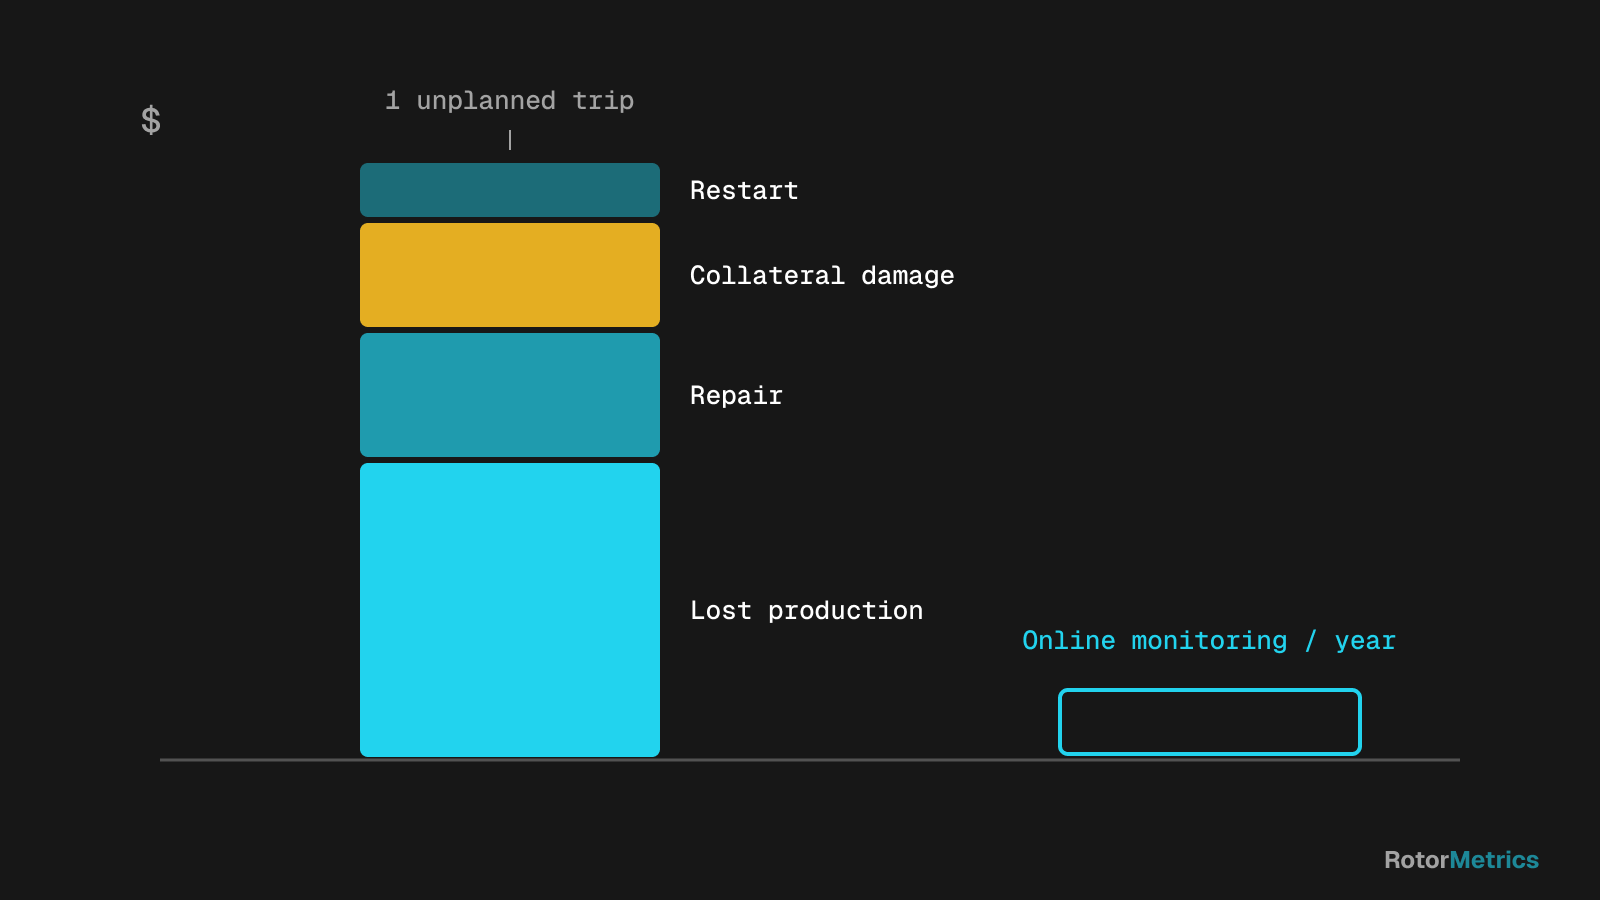
An unplanned shutdown costs far more than the repair bill. Break it into buckets, because each one comes from a different data source.
Lost production (margin, not revenue)
The classic mistake is multiplying downtime hours by revenue per hour. Use lost contribution margin instead: revenue minus the variable costs you don't incur while the unit is down (feedstock, energy, catalyst). Also ask whether production is truly lost or just deferred. If there is inventory, catch-up capacity, or a parallel train, the real loss is smaller.
Repair
- Parts: bearings, seals, labyrinths, blades, sometimes a spare rotor.
- In-house labor and contractors, including overtime.
- OEM services: field service reps, shop balancing, expedited freight.
Collateral damage
This is where early detection pays off most. A bearing replaced when it first starts to degrade is a job measured in days. The same bearing failing in service can take out seals, damage the journal, or cause a full rotor rub, and now you are talking weeks and long-lead parts.
Restart, flaring, penalties, and safety
- Restart costs: purging, process stabilization, off-spec product.
- Flaring, with its environmental and regulatory exposure.
- Contractual penalties for missed deliveries.
- Risk to people. It is often left unpriced, but it belongs in the case.
Duration
Use the typical duration of your own events, not the worst case. Split it into diagnosis, waiting for parts, repair, and restart. Waiting for parts usually dominates.
Step 2: probability and frequency, from your own history
The cost of one event isn't enough. You also need to know how often it happens. The rule here is strict: use your own history, not industry figures stripped of context.
- Go through work orders, operating logs, and failure reports for the last 10 to 15 years.
- Count unplanned shutdowns by failure mode: unbalance, misalignment, rub, fluid-film instability, thrust bearing, seals.
- If a machine has little history, pool similar units across your fleet.
- Note which events showed up in vibration before the failure. Not every failure mode is detectable through vibration, and the case should say so.
The output is an annual frequency per failure mode (one event every five years is 0.2 per year) and a sense of what fraction is detectable.
Step 3: the P-F curve and the value of lead time
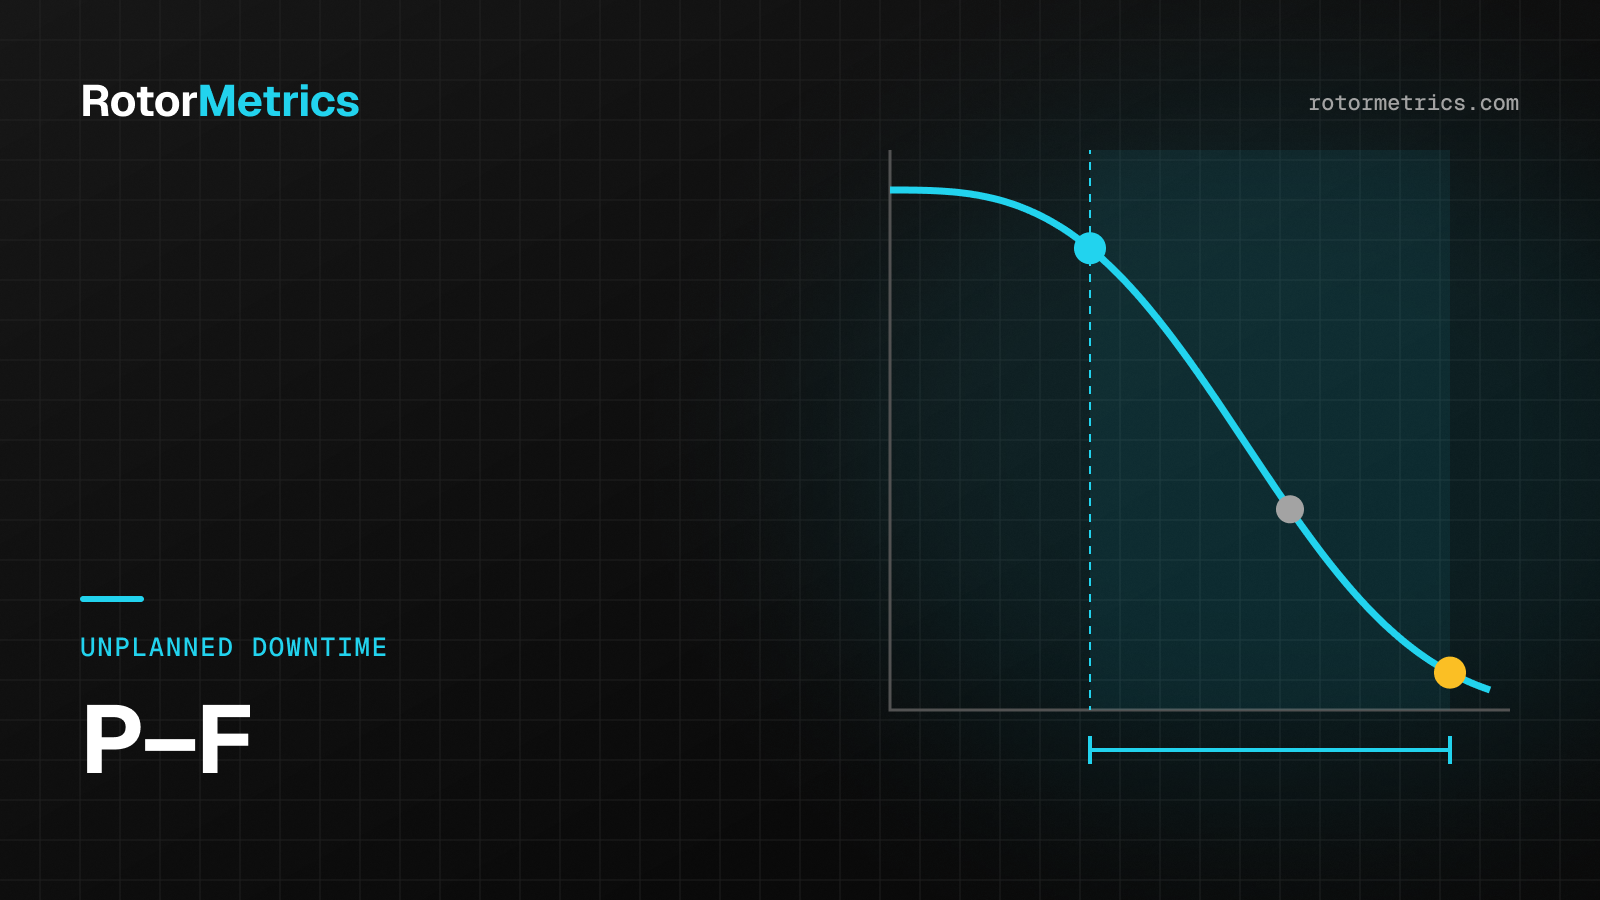
The P-F curve describes how equipment deteriorates. At point P the failure has started and can be detected; at point F the machine suffers a functional failure. The time between them is the P-F interval, and what matters is how much of it is left when you find out.
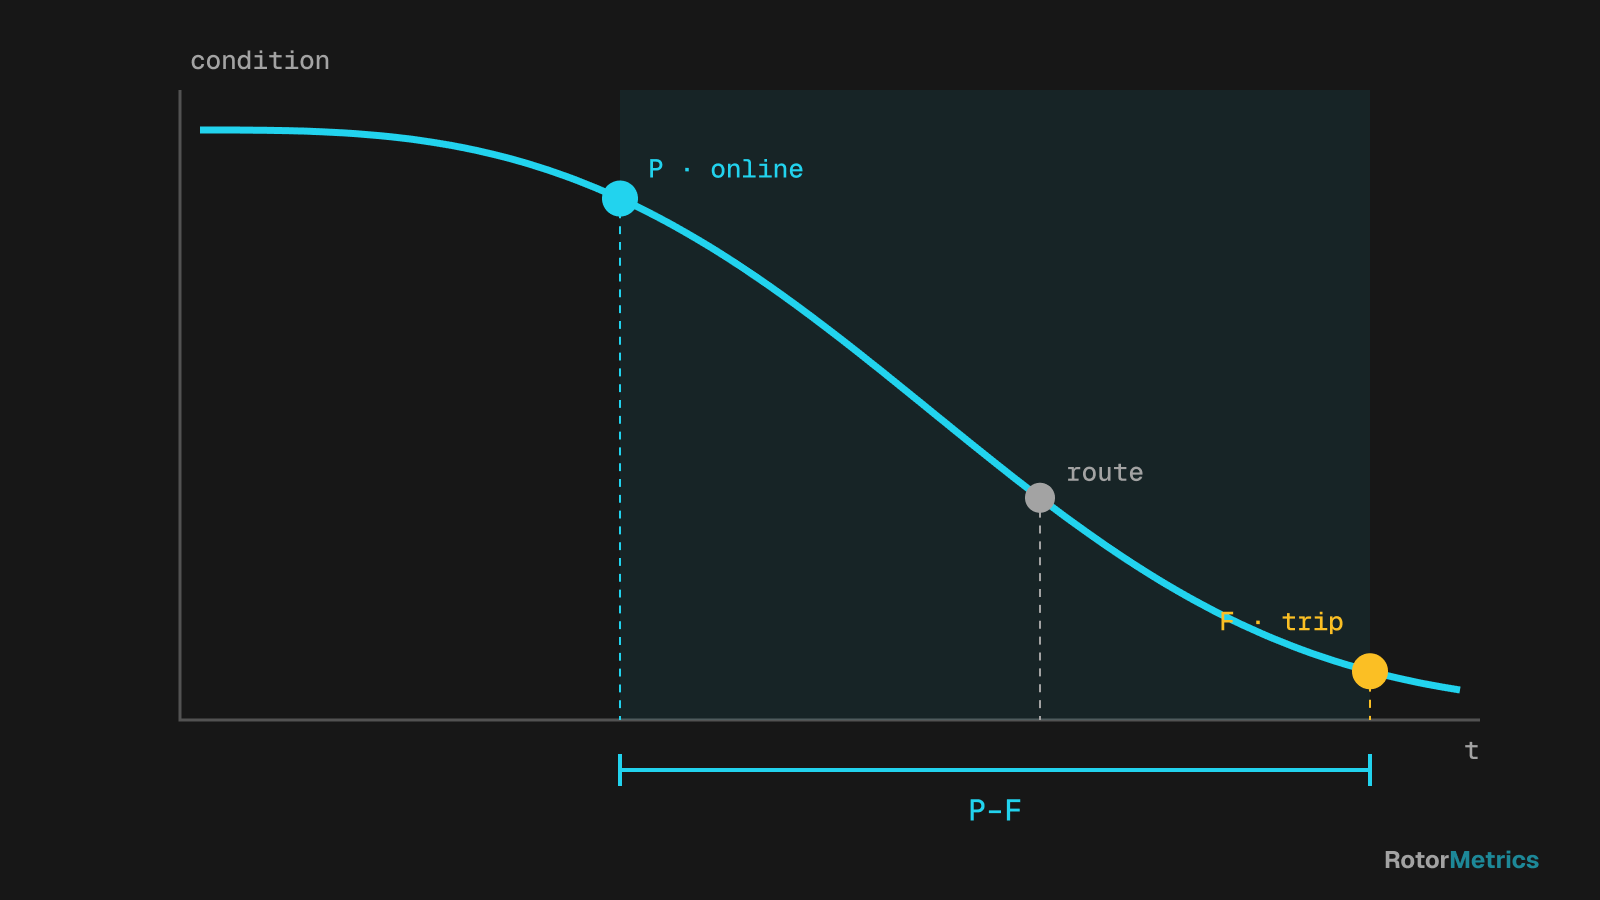
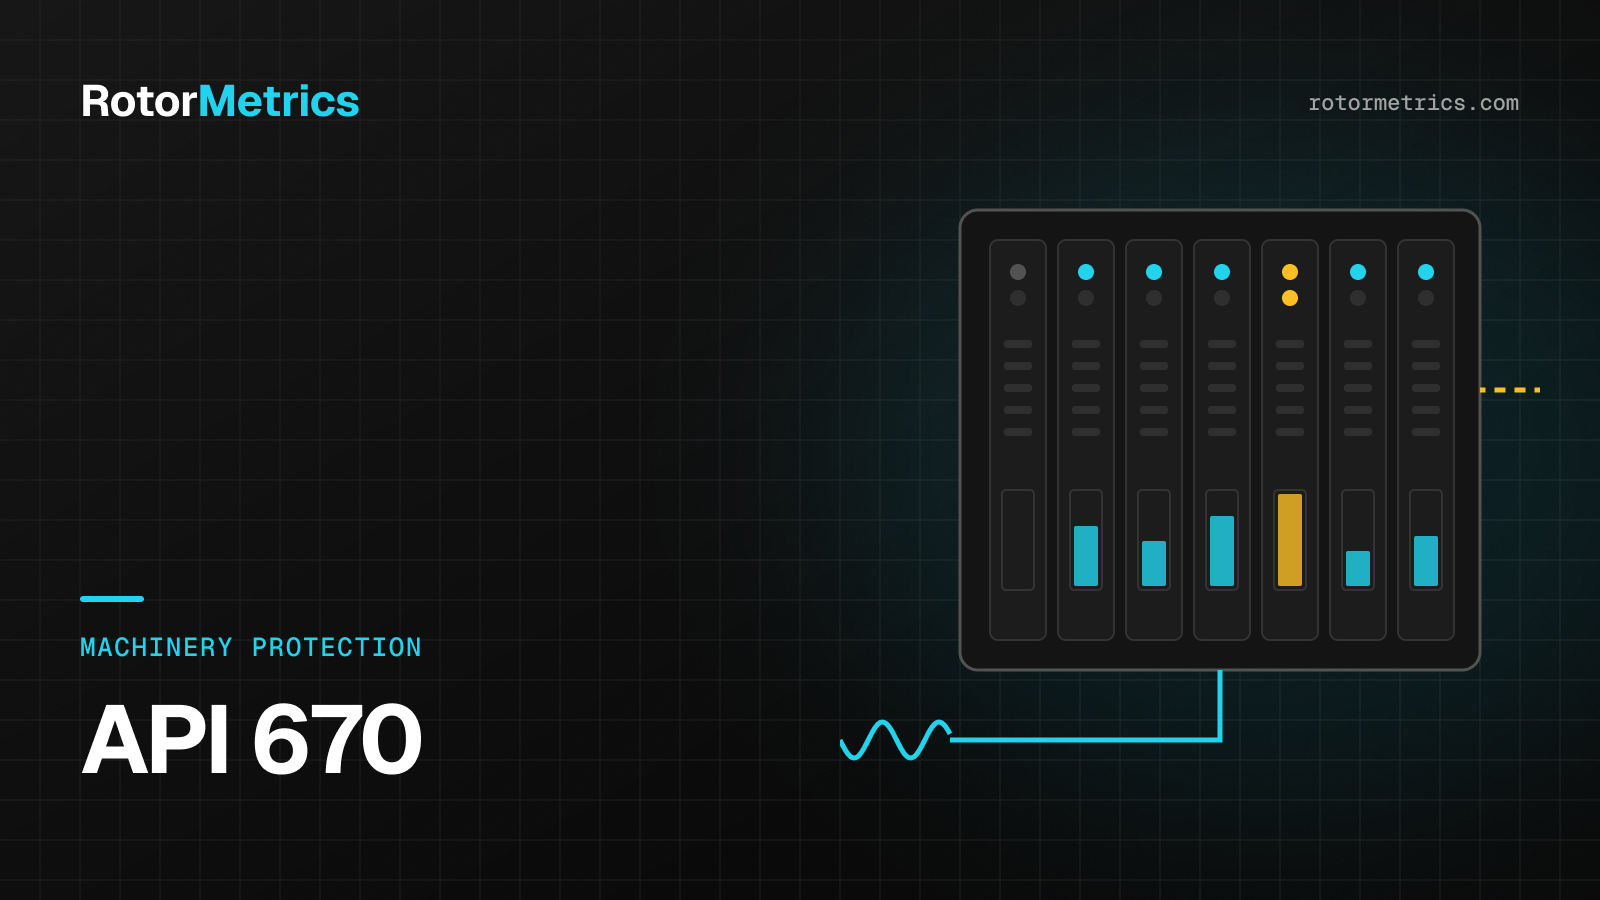
- Protection only: an API 670 protection system is designed to trip the machine, not to give you weeks of warning. By the time it acts you are usually close to F, and the shutdown is unplanned.
- Periodic routes: they depend on route frequency. If you collect data monthly and the P-F interval for that failure mode is a couple of weeks, you may never catch it. On machines with fluid-film bearings, a casing accelerometer route also tends to miss what the proximity probes see.
- Continuous monitoring: it trends 1X amplitude and phase, 2X, subsynchronous components, shaft centerline, and axial position around the clock. It typically detects closer to P and gives you days or weeks to plan.
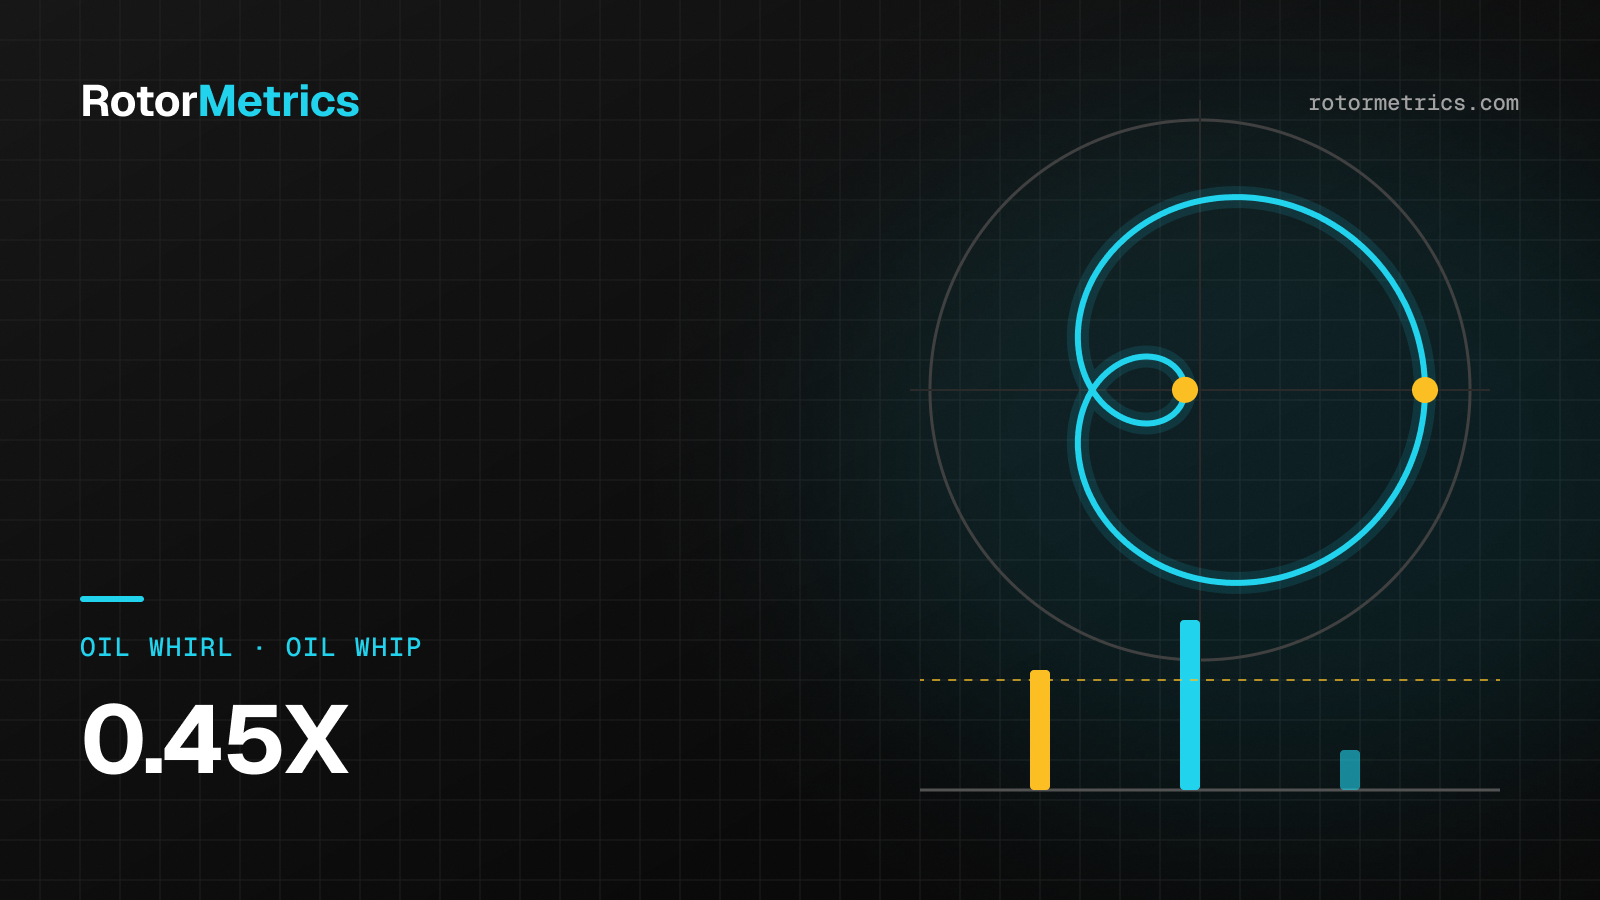
Some failure modes have short P-F intervals. With fluid-film instability, the difference is measured in hours, not weeks (see oil whirl and oil whip: fluid-film instability). Others, like unbalance building up from fouling, progress slowly enough that even a monthly route may catch them. That is why the analysis has to be done failure mode by failure mode.
Here is something the overall value hides: the overall reading can sit well below the alarm while a subsynchronous component is already showing in the spectrum.
Step 4: the math
The formula is deliberately simple:
Expected annual avoided cost = f × p × (C_unplanned − C_planned)
- f: annual frequency of the failure mode (from your history).
- p: probability of detecting it early enough to plan (a conservative estimate, per failure mode).
- C_unplanned: total cost of the event when it catches you by surprise (every bucket from Step 1).
- C_planned: cost of addressing the same problem in a planned window.
Compare that figure with the annual cost of the monitoring service. Here is the template:
| Item | How to estimate it | Data source |
|---|---|---|
| Lost margin per hour | Revenue minus avoided variable costs | Finance, planning |
| Unplanned duration (h) | Median of your own events | Logs, work orders |
| Unplanned repair | Parts, labor, OEM, expediting | Past event costs |
| Collateral damage | Extra parts when the failure progressed | Failure reports, OEM |
| Restart, flaring, penalties | Per event | Operations, environmental, commercial |
| Planned cost | Same repair in a scheduled window | Maintenance planning |
| f (events/year) | Count by failure mode | 10 to 15 years of history |
| p (timely detection) | Conservative, per failure mode | Documented engineering judgment |
| Annual service cost | Quote plus internal costs | Vendor, IT, engineering |
Illustrative example (hypothetical)
The numbers below are made up to show the method. They do not represent any plant and are not an expected result.
A turbocompressor with a lost margin of USD 8,000 per hour:
- Unplanned shutdown: 72 h × 8,000 = 576,000; repair including collateral damage 300,000; restart and flaring 50,000. C_unplanned ≈ USD 926,000.
- Same problem caught in time: 24 h × 8,000 = 192,000; repair without collateral damage 120,000. C_planned ≈ USD 312,000.
- Difference per event ≈ USD 614,000.
- History: one event every four years, f = 0.25. Estimated timely detection, p = 0.6.
Expected avoided cost = 0.25 × 0.6 × 614,000 ≈ USD 92,000 per year, against a hypothetical service cost of USD 40,000 per year.
Now the honest part: if your history shows one event every ten years (f = 0.1), the expected value drops to roughly USD 37,000 per year and no longer covers the service on that machine alone. That is a useful answer too. Maybe the case should cover a group of machines, or maybe that machine isn't the priority.
Common mistakes
- Using revenue instead of margin.
- Treating the worst event on record as the typical one.
- Assuming p = 1. No monitoring program catches everything, or always in time.
- Ignoring production that can be made up later.
- Leaving out the internal costs of monitoring: alarm handling, engineering time, IT, and cybersecurity.
- Presenting ROI as a guarantee. It is an expected value, with uncertainty attached.
- Dropping safety risk because "it doesn't have a number."
What to bring to management
- One page listing the critical machines, their cost per hour of downtime (margin), and their event history.
- The completed template, with the source of each figure and the assumptions flagged.
- A range, not a single number: conservative, base, and optimistic scenarios, plus sensitivity to f and p.
- What can't be priced: safety, environment, customer reputation.
- How you will measure it: which indicators you will review after 12 months (advisories issued, planned interventions, documented shutdowns avoided).
For a refresher on what vibration can reveal, read how to detect turbocompressor faults with vibration analysis, and for the role of protection, API 670 explained.
How we do it at RotorMetrics
We take the signal from your existing protection system, such as a Bently Nevada 3500, without modifying it. Our specialists review trends, spectra, and orbits continuously and alert you when something changes, with a concrete recommendation. If you'd like, we can help you fill in the template with your own data before you decide anything.
Sources
- American Petroleum Institute. API Standard 670: Machinery Protection Systems, 5th ed., 2014.
- Moubray, J. Reliability-Centred Maintenance (RCM II), 2nd ed. Industrial Press, 1997.
- Nowlan, F. S., and Heap, H. F. Reliability-Centered Maintenance. United Airlines / U.S. Department of Defense, 1978.
- Bently, D. E., and Hatch, C. T. Fundamentals of Rotating Machinery Diagnostics. Bently Pressurized Bearing Press, 2002.
- ISO 17359: Condition monitoring and diagnostics of machines — General guidelines.
Want us to watch your machine?
Let's talk about your critical equipment and we'll show you how we'd monitor it.
Book a call